

Working Capital Dashboard: A Practitioner's Build Guide for Mid-Sized Indian Companies
By BiPivot Team · 28 July 2026
Why is working capital suddenly a board-level agenda item in mid-sized Indian companies?
Ten years ago, working capital was a treasury footnote — something the CFO glanced at during the monthly close and forgot about until the next audit. That's changed. India Inc's net working capital cycle fell to a three-year low of 35 days in FY26, down from 43 days the year before, across more than 2,300 listed non-financial companies — a sign that better capital discipline is now a competitive weapon, not a nice-to-have.
For mid-sized companies, the pressure is sharper. Trade receivables alone account for 40-60% of total assets in many MSMEs, making them the single largest drain on liquidity even when the P&L shows healthy profit.
The challenge isn't a lack of numbers, but that traditional working capital management, often reliant on static, monthly reports, delivers insights too late for proactive decision-decision-making. A Working Capital Dashboard — built properly in Power BI, wired into GST, TDS, and bank data — closes that gap. This article is a practitioner's build guide, not a features tour.
What should actually sit inside a Working Capital Dashboard for an Indian mid-market company?
Most dashboards fail because they try to show everything. A working dashboard for an Indian CFO needs four layers, and each layer needs India-specific logic baked in, not bolted on.
Layer 1: Cash position — bank balances across all accounts, updated daily via bank feeds (UPI, NEFT, RTGS settlement files), reconciled against the cash book in Tally or your ERP. This is where most implementations quietly break, because UPI settlement batches and NEFT returns don't map cleanly to invoice-level cash books without a reconciliation layer.
Layer 2: Receivables (AR) — aged by 0-30/31-60/61-90/90+ days, segmented by customer, with a live overdue list and DSO trend, not just a snapshot.
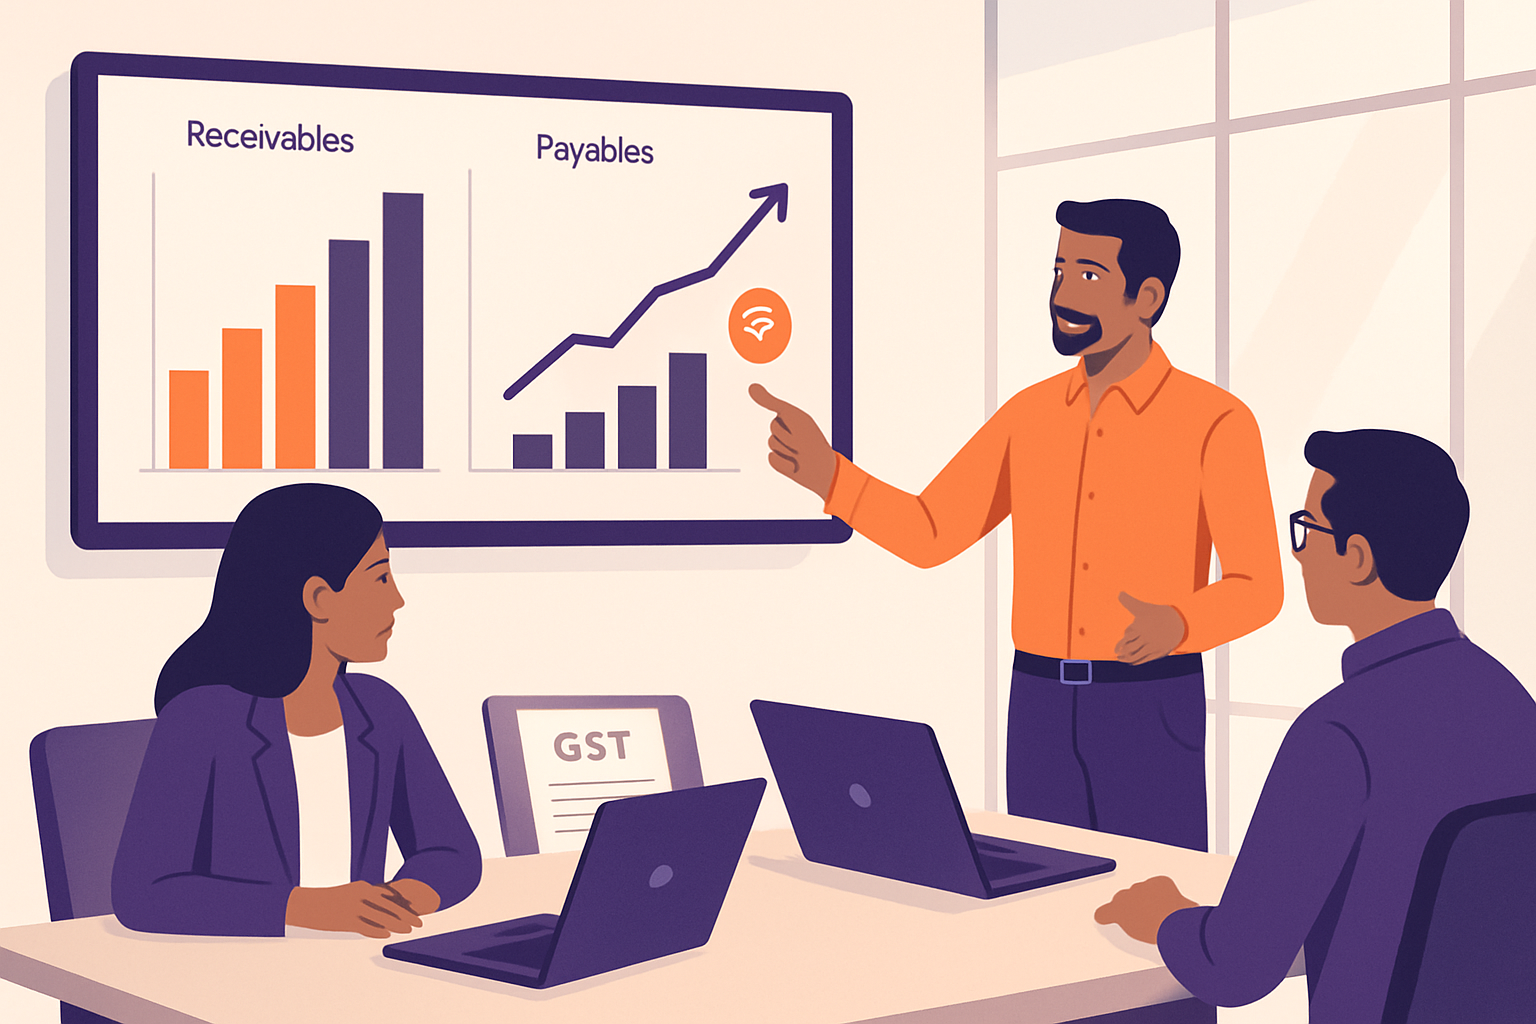
Layer 3: Payables (AP) — aged similarly, but split explicitly by MSME-registered vendors versus others, because adherence to MSME payment regulations, such as the 45-day payment rule, is crucial. A dashboard that doesn't flag "MSME payables crossing day 40" is missing a key regulatory risk in the AP book.
Layer 4: Inventory — value by SKU/category, ageing buckets, and a flag for stock older than 120 days, which is usually where working capital quietly rots in trading and manufacturing businesses.
Layered on top of all four: a GST reconciliation panel (ITC claimed vs ITC available in GSTR-2B, e-invoice IRN validation status) and a TDS obligations calendar. These aren't decorative — they change the actual cash number available on a given day.
How exactly does GST distort your working capital numbers — and can a dashboard fix it?
GST is not a pass-through tax in practice; it's a cash flow tax with a lag. GST creates temporary cash blocks for businesses through Input Tax Credit (ITC) delays and rate mismatches, necessitating higher working capital reserves and careful planning around tax payment cycles and refund timelines.
The compliance stakes went up further from April 2025, when the GST e-invoicing mandate dropped its turnover threshold, pulling a much larger base of SMEs and their mid-market customers into mandatory e-invoicing. That means your Working Capital Dashboard now needs a panel that:
- Ingests e-invoice IRN data as it's generated
- Flags any invoice without a valid IRN before it's booked as a receivable (unbilled e-invoices can trigger reconciliation issues and blocked ITC for your customer, hurting your DSO indirectly)
- Cross-checks GSTR-2B against your purchase register weekly, not at return-filing time
- Surfaces GSTIN mismatches on vendor master data — a common, boring, expensive problem
None of this requires exotic tooling. A Power Query refresh pulling GSTR-2B exports (via GSP API or manual download) into a staging table, joined against your purchase register on invoice number and GSTIN, run weekly, catches 80% of blocked-ITC cases before month-end panic sets in.
Does TDS deserve its own dashboard panel, or is it just an accounting entry?
Treat TDS as a cash flow line item, not a compliance footnote. TDS directly impacts business cash flow by reducing immediate receipts when customers deduct tax from payments and creating scheduled cash obligations for payments to vendors, contractors, and professionals by the 7th of the following month, creating a fixed, non-negotiable cash outflow.
The rules keep expanding. From April 1, 2025, Section 194T requires partnership firms and LLPs to deduct 10% TDS on partner remuneration, commission, bonus, and interest above a ₹20,000 threshold, impacting cash planning for these entities.
Build this panel with three columns: TDS deducted (payable to government), TDS deducted on you (netted from receivables), and upcoming due dates. It's a small addition, but it's usually the panel CFOs check first, because managing deadlines is crucial to avoid avoidable costs.
How do you actually get Tally, your ERP, and bank feeds into one Power BI model?
This is where most implementations stall, and it's rarely a Power BI problem — it's a data hygiene problem. Common pain points reported across Power BI rollouts — data integration complexity, security concerns, regulatory compliance, training and adoption challenges, and the attachment to legacy reports like Excel — all show up more sharply in working capital dashboards because the data spans four or five disconnected systems.
A realistic data map for a mid-sized Indian company looks like this:
- Tally/ERP (ledgers, AR/AP ageing, inventory valuation) → exported via ODBC connector or scheduled XML export
- GST portal / GSP (GSTR-1, GSTR-2B, e-invoice IRN log) → API pull or manual monthly download into a staging folder
- Bank statements (UPI settlement files, NEFT/RTGS advices, current account statements) → CSV/MT940 import, standardized into a common transaction schema
- Excel trackers (the ones nobody wants to admit still run the business) → migrated into a single "collections tracker" table with a defined refresh cadence, not left as fifteen versions on fifteen laptops
The fix isn't a big-bang ERP replacement. It's building a clean staging layer — even a simple set of Excel or SharePoint tables with strict column naming — that Power BI's dataflows pull from on a schedule (daily for cash and bank, weekly for GST, monthly for inventory valuation). Master data hygiene matters more than the visuals: if customer names in Tally don't match customer names in the bank narration field, your AR ageing will never tie back to actual receipts, and the dashboard will be distrusted within a month.
We've covered this foundational data problem in more depth elsewhere — see Why Excel Alone Is No Longer Enough for Mid-Sized Indian Companies for the specific case for moving off spreadsheet-only tracking. The working capital dashboard is really the sharpest example of why that matters: a P&L can survive on monthly Excel consolidation; a cash position cannot.
What metrics should the dashboard actually show — and which ones are vanity metrics?
DSO, DPO, DIO and Cash Conversion Cycle are the standard trio-plus-one, and they belong on the dashboard. But displaying them isn't the same as making them actionable. The difference is in what happens when a number crosses a threshold.
Here's a working capital cockpit structure that goes beyond the vanity view:
| Metric | Vanity version | Actionable version |
|---|---|---|
| DSO | "DSO is 58 days" | Alert: Customer X's ₹12 lakh invoice crosses 60 days on Thursday — auto-email to collections + flag for credit hold on new orders |
| DPO | "DPO is 40 days" | Flag: MSME vendor Y's payable crosses day 40 (5 days before Section 43B(h) breach) — escalate for payment run |
| Inventory | "Inventory value ₹4.2 crore" | Flag: SKU category "spare parts" has ₹38 lakh sitting 120+ days — trigger liquidation review |
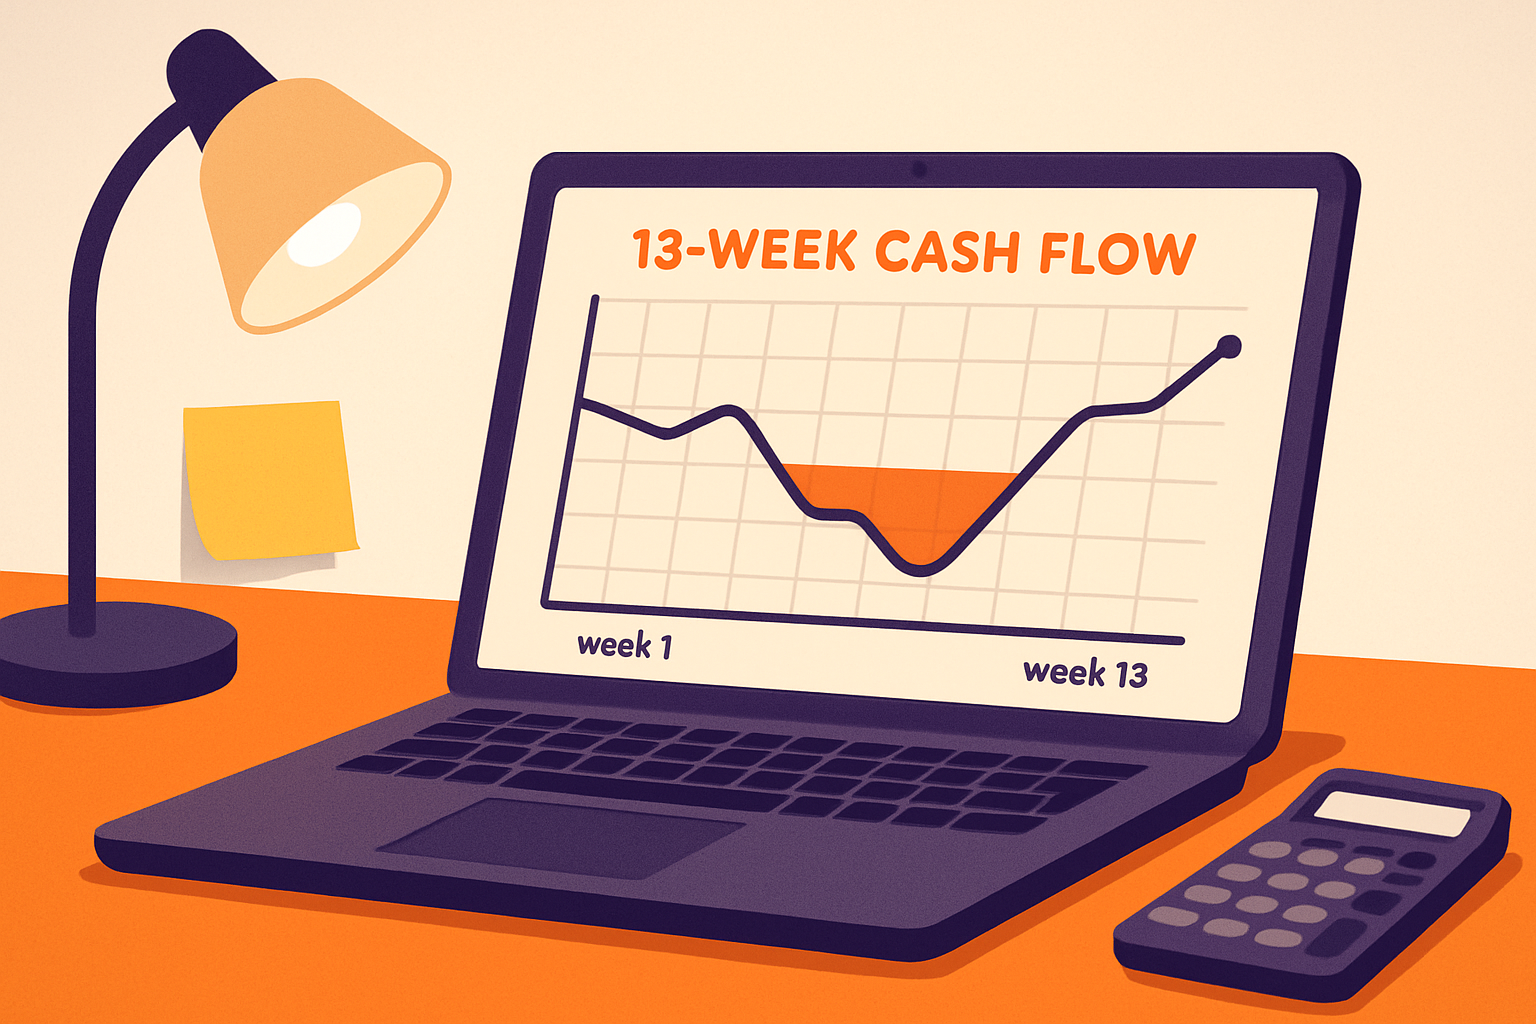
| Cash | "Bank balance ₹1.1 crore" | 13-week rolling cash ladder showing a projected shortfall in week 6 if collections don't accelerate |
The 13-week cash ladder deserves special mention — it's the single highest-value addition most mid-sized companies skip. Real-time data feeding this ladder is crucial for optimizing working capital, enabling companies to quickly adapt to changing market conditions, automate management processes, and enhance decision-making efficiency.
How does this connect to financing decisions, not just monitoring?
A live working capital dashboard changes financing conversations, not just operational ones. Indian CFOs are increasingly moving away from traditional working capital loans towards transaction-linked liquidity — such as supply chain finance and digital trade finance platforms — for faster and more flexible capital access, because these products require exactly the granular, real-time receivables and payables data a Power BI dashboard already produces.
There's also a sobering reminder in the funding data: Indian startups raised $30.4 billion in FY24, a 6.5% decline from $32.5 billion in 2023, and 12 funded startups still shut down. This emphasizes that capital raised doesn't guarantee operational liquidity — a lesson that applies equally to a mid-sized manufacturer with a healthy order book but a working capital cycle quietly stretching. The dashboard is what tells you that's happening before the bank does.
How do you get finance teams to actually use the dashboard instead of falling back to Excel?
Adoption is the quiet failure mode nobody talks about at the pitch stage. Industry data shows 58% of organizations say they're focused on increasing Power BI adoption, yet 84% report adoption rates below 50% — a wide gap between intent and reality, and it's usually not a technology problem.
Three things move the needle in mid-sized Indian finance teams specifically:
-
One page, one decision. The first dashboard screen a CFO opens should answer one question — "do we have enough cash for the next 4 weeks, and where's the risk?" — not display 12 charts competing for attention. Push the GST reconciliation detail, vendor-level AP ageing, and inventory SKU breakdown to secondary tabs.
-
A named champion, not a project team. In a 40-person finance function, appoint one person — usually a senior accountant comfortable with Excel formulas — as the dashboard owner. Give them 2 days of Power Query/DAX training and ownership of the weekly refresh checklist. This person becomes the translator between the "we've always used Excel" camp and the new system.
-
Kill the parallel Excel report deliberately, on a date. Most failed rollouts run the dashboard and the old Excel MIS in parallel indefinitely, which guarantees the Excel version wins because it's familiar. Set a hard cutover date — say, after two full month-end cycles of side-by-side validation — and retire the spreadsheet.
The training and adoption barriers reported across Power BI implementations — alongside data integration complexity and security concerns — are real, but they're solvable with sequencing, not more features. Security specifically matters here: working capital data touches bank balances and customer payment behavior, so row-level security (restricting a regional sales head to their own zone's receivables) should be configured from day one, not retrofitted after a data-access complaint.
What role does AI actually play here, beyond the buzzword?
Roughly 79% of Indian CFOs and treasurers believe generative AI and AI-powered tools will meaningfully improve risk mitigation and treasury operations — but the useful applications inside a working capital dashboard are narrower and more mechanical than the hype suggests.
Three practically useful AI layers on top of the base dashboard:
- Collections prioritization: a simple model scoring which overdue customers are statistically likely to pay within 7 days versus which need escalation, based on historical payment behavior — not a black box, just a logistic regression on past DSO patterns by customer.
- Demand-linked inventory flags: predicting which SKUs are trending toward the 120-day-slow-moving bucket based on the last 8 weeks of sales velocity, so procurement stops re-ordering before the dashboard even shows the ageing breach.
- Anomaly detection on vendor GSTIN and bank narration data: catching duplicate invoices or mismatched GSTINs automatically, which matters directly for ITC protection given the tightened e-invoicing net from April 2025.
Power BI's native AI visuals (key influencers, decomposition trees, anomaly detection) cover the first two reasonably well without custom data science work. The GSTIN/anomaly layer typically needs a lightweight Python or Power Automate script feeding back into the model. If your team is weighing how far to push AI versus simpler automation, the same framework in AI vs Traditional Automation in Finance: What Mid-Sized Indian Companies Should Actually Choose applies well to working capital: start with rules-based alerts, add prediction only where the pattern is genuinely non-obvious.
For finance leaders who've already built a real-time P&L view, extending the same Power BI model to working capital is a natural next step rather than a separate project — the P&L Dashboard Best Practices approach to moving from month-end reporting to a live command center applies directly here, just with cash and ageing tables replacing revenue and expense tables as the core fact tables.
What does a realistic 90-day build plan look like?
For a mid-sized company with Tally or a mid-tier ERP, no dedicated BI team, and a finance function of 15-40 people, here's a sequencing that avoids the common trap of trying to model everything at once:
- Weeks 1-3: Data audit. Map every source system, identify master data mismatches (customer names, GSTINs, vendor codes), fix the top 20 recurring mismatches manually.
- Weeks 4-6: Build the cash and AR/AP layer first — this delivers the fastest visible value and is the easiest to validate against existing reports.
- Weeks 7-9: Layer in GST reconciliation and TDS obligation tracking, validated against one full return-filing cycle.
- Weeks 10-12: Add inventory ageing, the 13-week cash ladder, and role-based access; run parallel with existing Excel MIS for one month-end cycle.
- Week 13 onward: Retire the parallel Excel report, appoint the internal champion permanently, and schedule a quarterly review to add AI-based collections scoring once the base data is trusted.
This mirrors how internal audit teams are increasingly sequencing AI adoption too — start narrow, prove value on one process, then expand, a pattern discussed in AI for Internal Audit: Practical Use Cases for Mid-Sized Indian Companies.
How BiPivot helps
BiPivot builds India-specific Power BI working capital dashboards that connect Tally/ERP, GST data, TDS obligations, and bank feeds into one governed model — not a generic template retrofitted with local labels. If your team is stuck between spreadsheet fatigue and a half-adopted BI rollout, talk to us at bipivot.com about a focused 90-day build.