

Dashboard Requirements for Pharma Companies: A CFO's Blueprint for Mid-Sized Indian Firms
By BiPivot Team · 6 September 2026
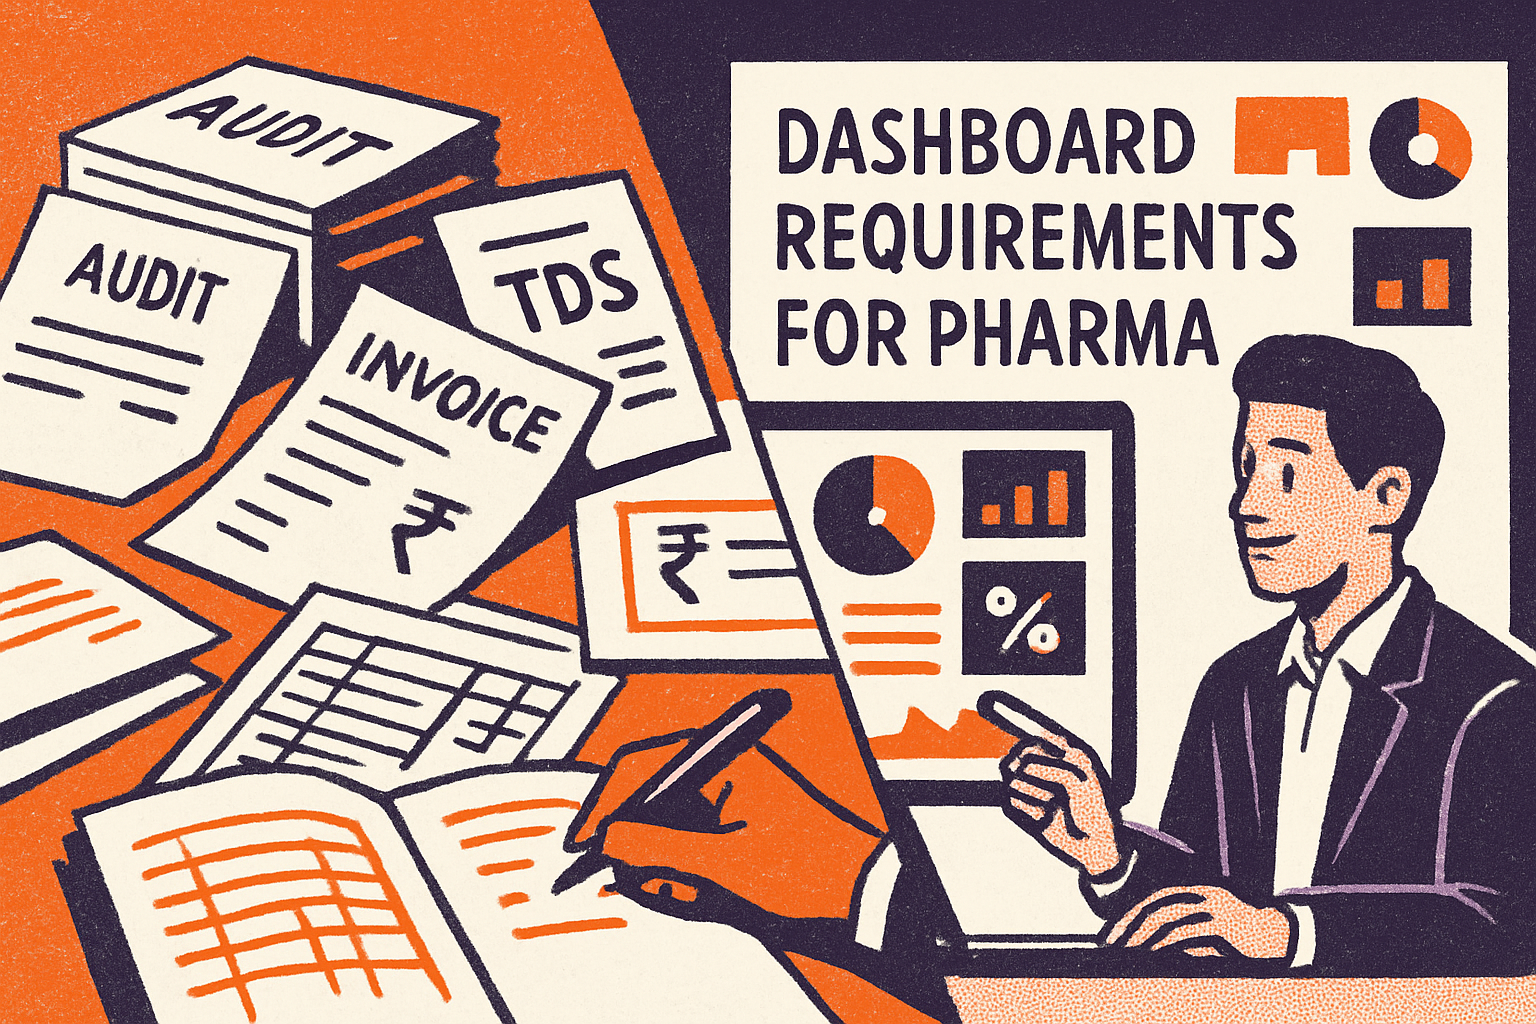
Most finance heads at mid-sized Indian pharma companies already have a dashboard. The problem is that it tells them what happened three weeks ago, not what's about to go wrong. If your monthly MIS pack still arrives as a 40-tab Excel file stitched together from Tally exports, warehouse spreadsheets, and a CFA's WhatsApp update, you don't have a dashboard — you have a delayed obituary of last month's decisions.
The Indian pharmaceutical market is projected to hit USD 60.32 billion in 2026 and grow to USD 79.74 billion by 2031 at a 5.74% CAGR (Mordor Intelligence). That growth is real, but it's arriving inside a regulatory and pricing environment that changes every few quarters — GST 2.0 rate cuts, revised Schedule M plant standards, TDS on marketing spend, and an MCA filing calendar that doesn't forgive delays. A dashboard built for a generic mid-market manufacturer won't catch any of this. A dashboard built for pharma has to.
Why do generic finance dashboards fail pharma companies specifically?
Pharma is not manufacturing-plus-compliance. It's a business where three things collide in ways most ERP-standard reports were never designed to show together: regulated pricing, a three-tier distribution model, and R&D spend that has to justify itself against tax incentives and product pipelines.
Consider a mid-sized formulation company in Ahmedabad doing ₹280 crore in annual turnover. Its standard MIS shows revenue by SKU and gross margin by plant. What it doesn't show, without someone manually cross-referencing three systems, is:
- Which SKUs just became GST-exempt or moved to the 5% slab under GST 2.0 (effective September 2025), and what that does to net realization per unit (Grant Thornton).
- How much of this month's "marketing and promotion" spend crosses the ₹20,000 threshold per recipient under Section 194R, triggering 10% TDS obligations the company may not have provisioned for (Income Tax Department).
- Whether inventory sitting with a stockist in Nagpur is actually sellable, or aging toward expiry and margin write-off.
None of these are exotic requests. They're the daily reality of running pharma finance in India. The reason most dashboards miss them is that they were built as reporting tools, not as decision infrastructure — a distinction we've made before in our piece on ERP reporting best practices for mid-sized Indian companies, which is worth reading if your core problem is still "the numbers don't match between systems" rather than "the numbers are right but I can't act on them fast enough."
What should a pharma finance dashboard actually track?
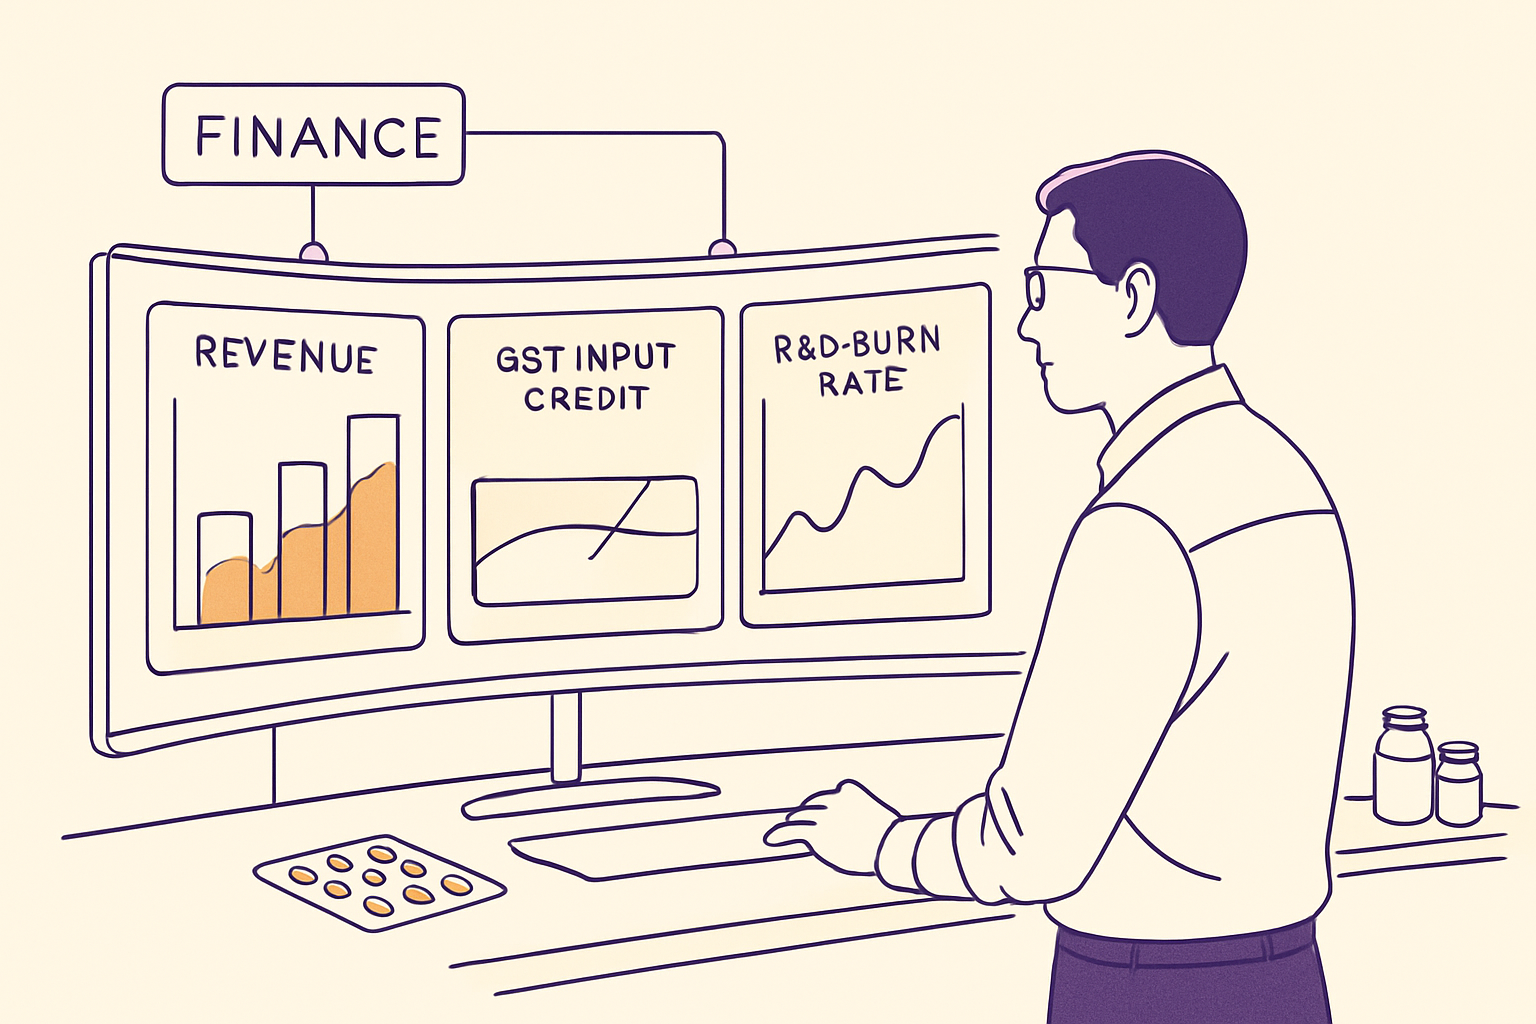
Strip away the vendor slideware and a genuinely useful dashboard for an Indian pharma CFO needs five layers, each answering a different question a board member or auditor will eventually ask.
1. Revenue and realization, not just topline sales. Track gross sales, trade scheme deductions (which in pharma routinely run 8-15% of MRP), GST impact by slab, and net realization per therapy segment — oncology, cardiac, anti-infective, generics — separately. A single blended "revenue" number hides which segments are actually profitable after GST 2.0's rate compression on essentials.
2. Manufacturing cost against a moving benchmark. Manufacturing costs typically eat 20-30% of total drug revenue for mid-sized players (JD Pharma Consultant). A dashboard should flag when any plant or product line crosses its historical cost band by more than, say, 3 percentage points in a month — that's usually the first signal of an API price spike, yield loss, or a Schedule M-driven capex absorption issue before it shows up in the P&L review two months later.
3. R&D spend against both pipeline milestones and tax treatment. Indian pharma companies typically allocate 5-10% of revenue to R&D (BioSpectrum India). For a ₹300 crore company, that's ₹15-30 crore a year that needs to be tracked not as a lump "R&D expense" line but split by project, by capitalisable vs. expensed spend, and against any weighted deduction the company is claiming. Finance teams that can't produce this split on demand end up either under-claiming benefits or scrambling during a tax assessment.
4. Distribution and inventory health across the CFA-stockist-pharmacy chain. This is the layer most dashboards get badly wrong, and it deserves its own section below.
5. Compliance status as a live traffic light, not a quarterly checklist. Pharma companies in India manage over 950 ongoing compliances annually, nearly half of which carry imprisonment clauses for non-adherence (TeamLease RegTech). That number should make any CFO uncomfortable enough to want this on a dashboard rather than in a compliance officer's personal tracker.
How do you build cash flow visibility into the CFA-stockist-pharmacy chain?
This is where generic FMCG-style distribution dashboards (see our finance automation guide for FMCG for that world's version of the problem) don't map cleanly onto pharma, because pharma's chain has an extra layer of regulatory friction: batch-level traceability, expiry-linked returns, and price control on scheduled formulations.
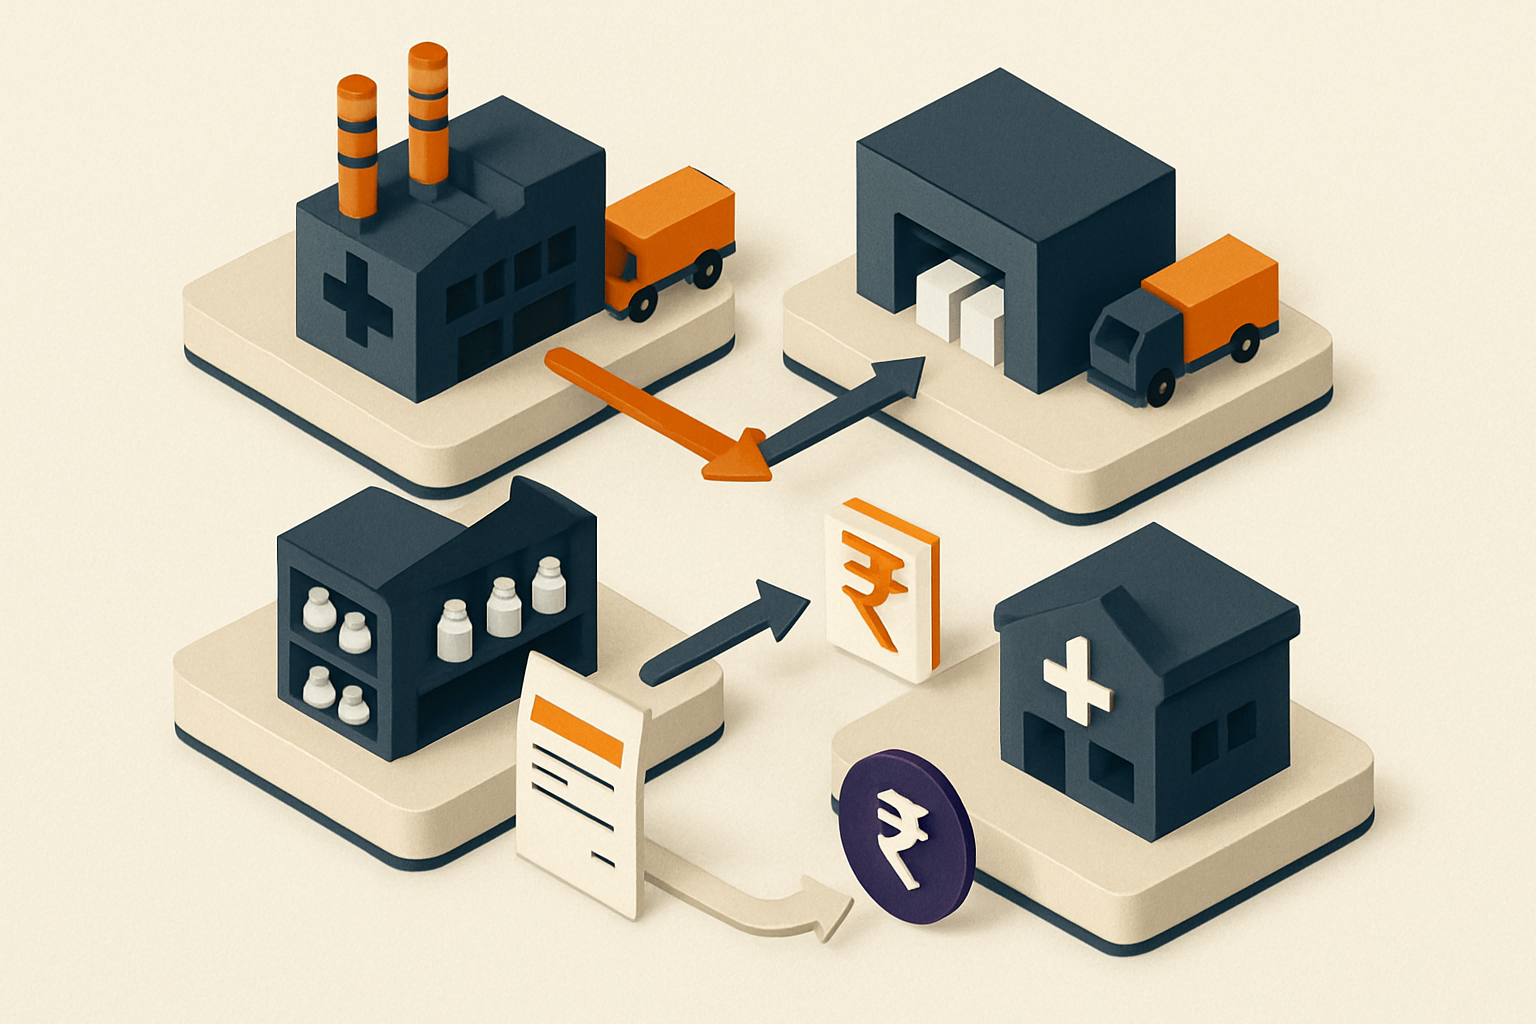
Here's a worked example. A mid-sized generics manufacturer ships ₹4 crore of product monthly to its CFA in Indore, which redistributes to roughly 220 stockists across Madhya Pradesh and Chhattisgarh, who in turn supply about 3,500 retail pharmacies. Without integrated visibility, finance only sees "CFA payment received" and "stockist credit outstanding" as two disconnected numbers, often 45-60 days apart.
A dashboard built for this chain should surface, in one view:
- Days sales outstanding by stockist tier, not just an aggregate DSO number. If the top 20 stockists (who typically carry 60-70% of volume) are creeping past their 30-day credit terms, that's a working capital problem forming in real time, not a quarter-end surprise.
- Batch-level inventory age at CFA and stockist level, flagged against expiry date. A product with 18 months shelf life sitting unsold at 14 months is a write-off waiting to happen — and in our experience, most mid-sized companies discover this only when the stockist returns it.
- Scheme and discount leakage — the gap between the invoiced trade discount and what's actually being passed through at the pharmacy counter.
Do the math on just the DSO piece: if ₹4 crore in monthly billing slips from an average 35-day collection cycle to 50 days across even a third of the stockist base, that's roughly ₹65-70 lakh of additional working capital locked up every month, financed at whatever the company's cash credit rate is — commonly 10-11% per annum in the current rate environment. That's a real, recurring cost that a live dashboard would have flagged in week two, not month three.
How does GST 2.0 change what finance needs to monitor?
GST 2.0, implemented in September 2025, cut GST rates on essential medicines and medical devices to 5% or 0%, with 33 life-saving medicines becoming fully exempt (Grant Thornton). Good news for patients, immediate complication for finance teams, for one specific reason: input tax credit.
When a finished product moves to a lower slab or full exemption, the input tax credit position on raw materials, packaging, and job-work services used to make that product doesn't automatically stay clean. Companies that don't re-map their ITC eligibility by SKU risk either over-claiming credit (an audit exposure) or under-claiming it (a margin loss they never notice). We've written in detail about how AI-assisted reconciliation catches exactly this kind of drift in our piece on GST reconciliation using AI and in common GST errors AI can detect before they cost you ITC — both worth reading alongside this article if GST 2.0 has changed even 10-15% of your SKU mix.
For a dashboard specifically, the requirement is a live view of: ITC claimed vs. ITC eligible by product category, flagged whenever a SKU's slab classification changes, with an automated alert rather than a discovery during the next GSTR-2B reconciliation cycle.
What compliance signals actually need to be on the dashboard, not in a filing cabinet?

Three specific regulatory items deserve dedicated, always-visible dashboard widgets for pharma companies, because the consequences of missing them are disproportionate to how easy they are to track:
Section 194R TDS on marketing benefits. Since July 1, 2022, any benefit or perquisite over ₹20,000 given to a resident — including physician samples, sponsorships to conference travel, and gift hampers, which are historically routine pharma marketing tools — attracts 10% TDS (Income Tax Department). A dashboard should aggregate spend per recipient across the year, not per transaction, because it's cumulative crossing of the threshold that triggers the obligation. Miss this and you're looking at disallowed expenditure plus interest on unpaid TDS during assessment.
Schedule M / GMP compliance status by plant. The revised Schedule M standards are now mandatory for all manufacturers, raising the bar to global GMP norms (Indswift). Finance rarely owns this directly, but the capex and remediation spend required to stay compliant — HVAC upgrades, validation documentation, quality lab investment — needs to sit on the same dashboard as cash flow projections, because a plant that fails a Schedule M inspection can be shut down, and that's a revenue event, not just a quality event.
MCA filing calendar with lead-time buffers. This one is almost embarrassingly simple to fix and yet routinely causes late-filing penalties at mid-sized companies: a rolling 60-day-out view of every MCA, ROC, and statutory filing due, color-coded by how much documentation is still pending. If your CFO team is still tracking this in someone's Outlook calendar, it should move to the dashboard this quarter.
Given the 950-plus compliance items pharma companies juggle annually (TeamLease RegTech), no dashboard can show all of them with equal prominence — nor should it. The design discipline that matters is surfacing the 15-20 that carry financial or criminal liability at the top, and letting the rest live in a searchable secondary layer.
How do you handle data integration without a two-year IT overhaul?
This is the objection every mid-sized pharma CFO raises, and it's legitimate: "our ERP doesn't talk to our quality system, which doesn't talk to our warehouse software, and we don't have budget for an SAP-wide implementation." Fair. You don't need one.
Data integration from disparate systems — ERP, quality control, supply chain — is a well-documented challenge, but modern dashboard tools are specifically designed to sit on top of these systems rather than replace them (FireAI). The realistic sequencing for a ₹150-500 crore turnover company looks like this:
- Month 1-2: Connect the finance dashboard directly to your ERP (Tally, SAP Business One, or similar) for revenue, cost, and TDS/GST data. This alone eliminates most manual Excel consolidation.
- Month 3-4: Layer in warehouse and CFA data feeds — even a structured daily CSV export is enough to start, it doesn't need to be a real-time API initially.
- Month 5-6: Add quality/compliance system data for Schedule M and batch-tracking visibility.
This staged approach matters because roughly 55.6% of Indian pharma organizations have only partially implemented digital systems for quality management, with just 33.3% at near-complete digital maturity (MarketScreener/Archimedis) — meaning most of your peer companies are somewhere in this same staged journey, not starting from a blank slate but not fully there either. You're not behind by trying to move in phases; you'd be behind by waiting for a "perfect" all-at-once integration that never gets funded.
If your finance team is also experimenting with AI tools to speed up analysis and drafting alongside this dashboard build, our comparison of ChatGPT vs Claude for finance teams is a useful adjacent read — dashboards handle structured, repeatable KPI tracking; conversational AI tools are better suited to ad hoc analysis and drafting the board commentary that sits alongside the numbers.
What does predictive, rather than reactive, pharma finance actually look like?
Digital transformation in Indian pharma is projected to grow at a 19.2% CAGR between 2024 and 2029 (Actiza Pharma), and the practical payoff of that investment, for finance specifically, is moving from dashboards that report to dashboards that warn.
Concretely, this means:
- Compliance forecasting: flagging that a plant's Schedule M remediation spend, at current pace, won't be complete before the next scheduled inspection window — six months before the inspection, not six weeks before.
- Cost drift alerts: using trailing 12-month API price trends to flag when a formulation's manufacturing cost is likely to breach the 30% revenue threshold next quarter, so pricing or sourcing decisions can be made proactively.
- Inventory aging prediction: modeling which batches at which stockists are statistically likely to expire unsold based on historical sell-through rates by region, rather than discovering it at the return note stage.
None of this requires exotic AI infrastructure. It requires a dashboard that's already capturing clean, integrated data consistently enough that trend-based flags become reliable — which is exactly why the phased integration approach above has to come first.
How BiPivot helps
BiPivot works with finance teams at mid-sized Indian pharma companies to design dashboards that sit on top of existing ERP, warehouse, and quality systems — no rip-and-replace required — surfacing GST 2.0 exposure, Section 194R thresholds, and CFA-stockist cash flow in one view built for how pharma finance actually operates. If your team is deciding where to start, our consulting engagements typically begin with a two-week data audit to identify which three integrations will give you the fastest visibility gains. Explore more at bipivot.com.